Organized Analytics

DON’T OVERLOOK THE DATA
Launching a website or mobile app, or sending an email to prospective clients can feel like the end of a project. The hard work is done and now it’s out in the world for other people to view. But don’t cross that project off your to-do list yet, you’re only halfway done. The data we collect from efforts like marketing campaigns and traffic to your website is incredibly important to analyze, organize and understand on a regular basis. It can tell you what is and isn’t working, where website visitors spend the most time, what part of a prospective email got the most attention and so much more. So it’s important to set up a data tracking system, like a dashboard, that makes it easy to save, analyze and reference the data whenever it is needed.
BUILD YOUR BEST DASHBOARD
A dashboard is a great way to consolidate data in an easy-to-read format. It allows you to view trends over time and others in your organization to easily view and understand it. There is no right or wrong way to build a dashboard, because different metrics are important to different organizations depending on designated key performance indicators (KPIs). Before starting your dashboard layout, it’s helpful to answer these questions:
- What problem are you trying to solve?
- What are you trying to measure?
- Which metrics matter the most to you?
- Who else will be referencing this dashboard?
Once you have answered these questions, it should be easier to determine which metrics to include and the best layout to use for easiest interpretation.
METRICS TO TRACK
Your business goals should drive which metrics you decide to include in your dashboard. By identifying your primary business goals, you can determine which secondary goals are needed to achieve the primary goals. These secondary goals can include KPI’s like:
- Website traffic
- Website form completions
- Phone number clicks
- Resource downloads
- Social media followers/engagement
- Email opens/clicks
If all of these metrics are important, create multiple dashboards for each data set. This will help avoid confusion and misinterpretation of the information.
DASHBOARD LAYOUT
There are lots of different ways to display the data in your dashboard. Google Docs and Sheets offer tables, pie charts, bar graphs, column graphs and line graphs. Line graphs tend to work best for seeing trends over time, like website traffic and social media followers. Pie charts work best when comparing the data points against each other, like new vs. returning website visitors and the most common social media engagement: likes, shares, comments, etc.
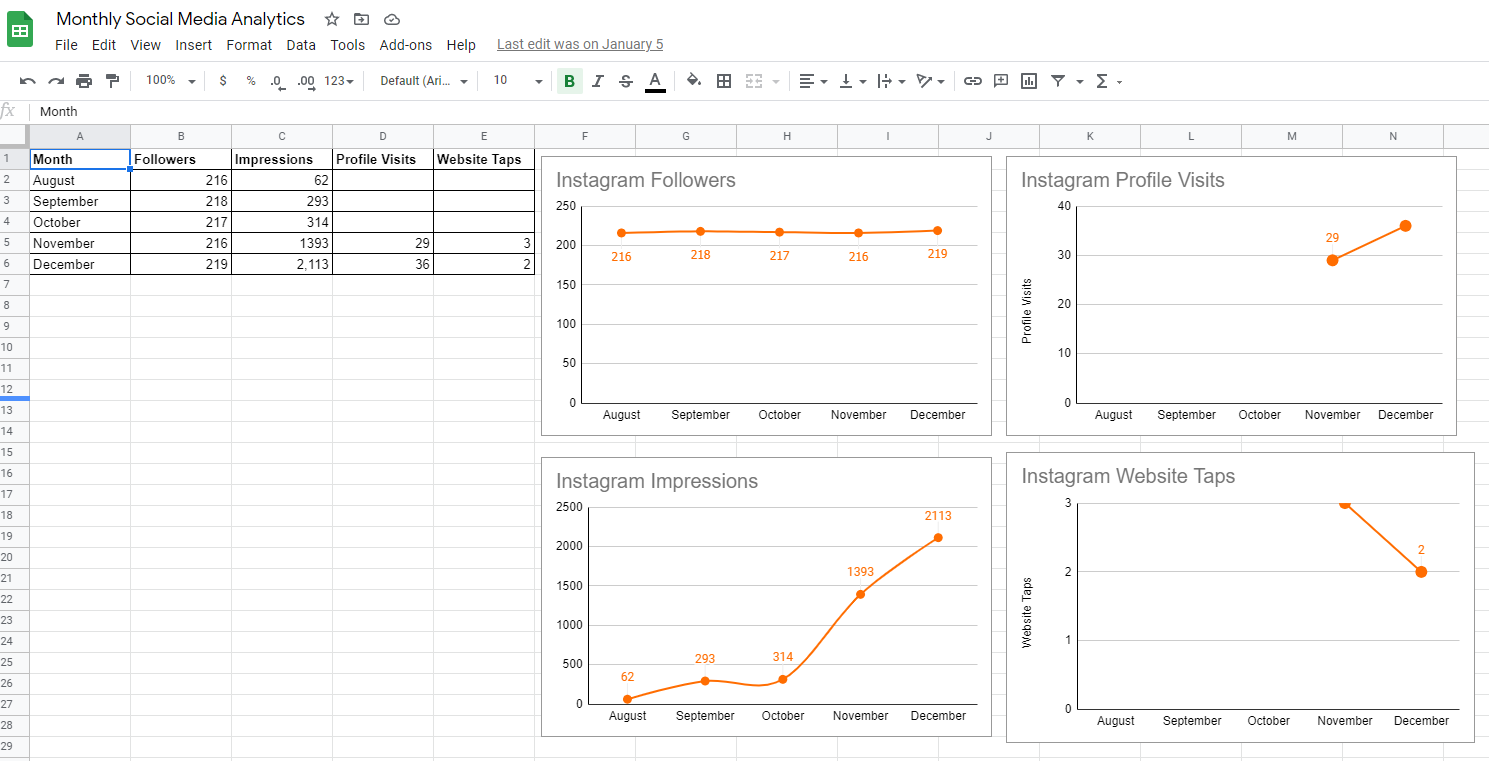
Here’s a look at a Terrostar social media dashboard. It includes line graphs and tables used to keep track of followers, engagement and website clicks.
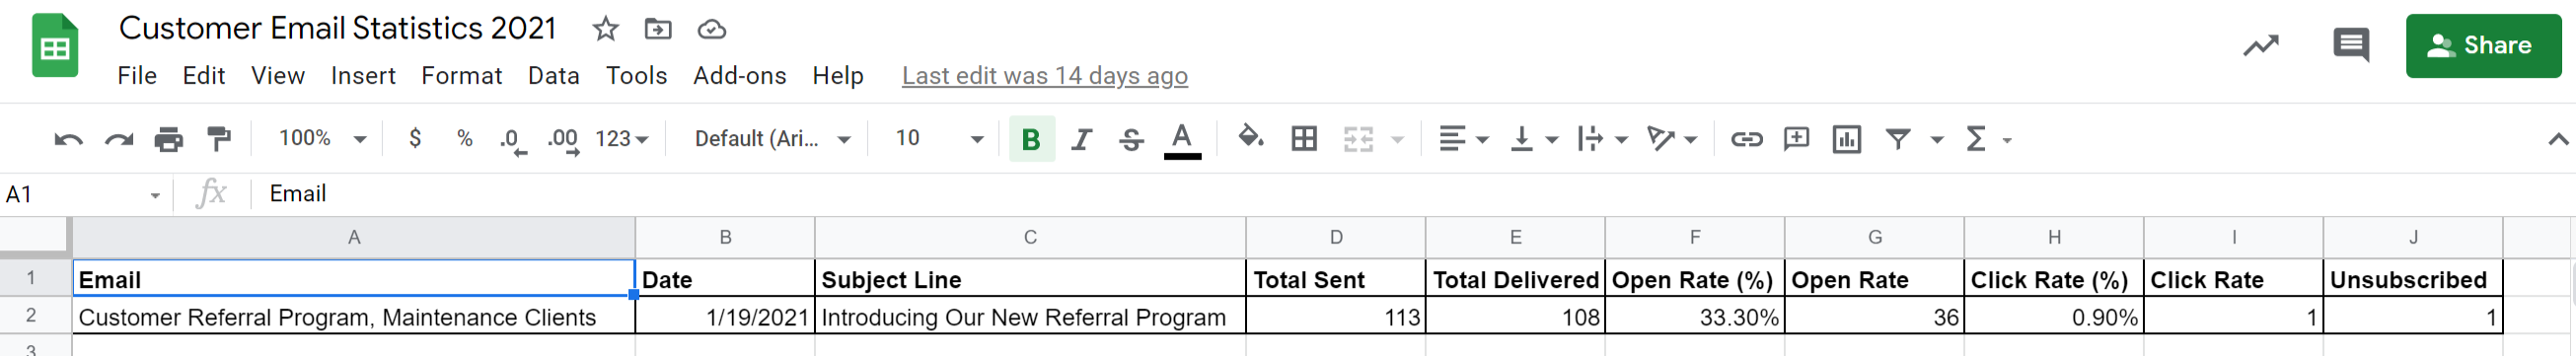
And we have a different layout for our email campaigns. A simple table allows us to track open and click rates, subject line, date sent and unsubscribes. This will also allow us to look back at the end of the year to see how many emails were sent and which email(s) performed the best.
WHEN TO RECORD ANALYTICS
It’s important to stay on top of your dashboard. It is meant to be a reference tool when needed, but that doesn’t help if it’s not consistently updated. Most data, like website traffic and social media stats, can be tracked monthly. At Terrostar, we record social media stats at the beginning of each month for the previous month. So at the beginning of February, we’re tracking all of January’s stats. This allows us to get a full picture of trends during the month and go back to any particularly high performing days to see what caused the spike in traffic or engagement. Emails, however, have a shorter tracking time: one week after the email is sent. Emails receive the most opens and clicks in the 24 hours after sent, with a few stragglers over the next five days. So one week after the email is sent gives a good representation of the email’s performance.
DASHBOARD TOOLS
If you’re looking for a platform beyond a word document or spreadsheet, there are analytics dashboard tools available to help display data in a more robust layout. CodeCondo but together this list of 10 dashboard building tools:
- SignX
- HappyMetrix
- DashThis
- Geckoboard
- ZoomCharts
- MicroStrategy
- Google Analytics Solutions
- Klipfolio
- Cyfe
- IBM Watson Analytics
DATA-DRIVEN STRATEGY
Tracking your information in a dashboard will help with data analysis and strategic planning for monthly website, social and email initiatives. Viewing trends over time will help point these initiatives in the right direction based on what has already worked for your target audience.