Prioritizing Social Media Metrics

SOCIAL AWARENESS
Social media profiles are important tools for companies to have. They allow for easy engagement with customers and give prospective customers an inside look at the company’s culture and personality. It might just seem like posts about current events of the company, celebrations of goofy holidays and employee milestones, but social profiles play a big role in brand awareness. Consistent posting and engagement on social media can also share important information about how visitors engage with your page. Setting goals for social media profiles provide direction for the amount of time spent on building up the profiles, the types of content to be shared and even the way copy for posts are written. Common social media goals include:
- Driving traffic to your website
- Increasing brand awareness about your products/services
- Increasing followers
- Engagement with prospective customers and other companies in the industry
- Position your company as a thought leader by sharing educational content
UNDERSTANDING THE ANALYTICS
Social media platforms offer a wide variety of analytics, from follower counts to post engagement, link clicks and more. The information these analyses provide tell different parts of the story, and it’s important to understand the findings from each.
VANITY METRICS
Vanity metrics, like page followers and likes, give insight into your audience. It’s easy to get caught up in these analytics since they are easy to track and easy to understand. But they shouldn’t be the only metrics you are tracking. It’s more important to track how your followers interact with your content.
ENGAGEMENT METRICS
Engagement metrics include post likes, comments, shares, clicks, retweets, etc. Understanding how your audience engages with your content, and what they engage with the most will help to define your social content strategy for the future. You know what type of content to include more of, and you can use underperforming posts as tests. Try a similar type of post with a different approach to the copy. Were you trying to get your audience to read a blog article, but didn’t actually ask them to. Next time, give a more direct call-to-action, and see if that improves the click rate.
AWARENESS METRICS
Awareness metrics, consisting of impressions and reach, are important to track if increasing brand awareness is one of your website goals.
Impressions are the amount of times your content shows up in someone’s timeline
Reach is the number of potential, unique visitors a post could have.
When analyzed together, engagement metrics and awareness metrics can give you a better understanding of the content that is most interesting to your audience. If a post has high impressions but a low engagement it wasn’t very relative for your followers. If a post has high impressions and a high engagement rate, that’s resonated well with your audience, and therefore the type of content you need to create more of.
REFERRAL METRICS
Referral metrics are important to track if increasing website traffic is one of your social goals. Referral metrics analyze the amount of visitors who landed on your website from your social media profiles, and if they make a purchase. The referral data is easy to find in your Google Analytics profile. “Social” is one of the categories listed in the Acquisition overview showing where most of your website visitors come from.
Facebook offers advanced metrics on website traffic from your profile with the Facebook pixel. If you’re interested in learning more about the Facebook pixel, click here.
TRACKING OVER TIME
If social media is part of your overall marketing plan, then it is important to track your metrics each month. But don’t just look at each month individually. Looking at the data over time can help you understand what has performed best, worst and everywhere in between.
Here at Terrostar, we set up a simple Google Spreadsheet with a table and line graphs. We’ve discovered looking at trends in a graph is easier than a table. The spreadsheet has a separate tab for each social platform, and tracks key metrics based on our social goals. All it took was creating the table to pull data from, and then inserting the chart by clicking Insert>Chart> Smooth Line Graph. From there, Google Sheets has the capability to customize the chart to your preferences. Our chart has customized titles, colors, size of the points, point labels, and X and Y axes.
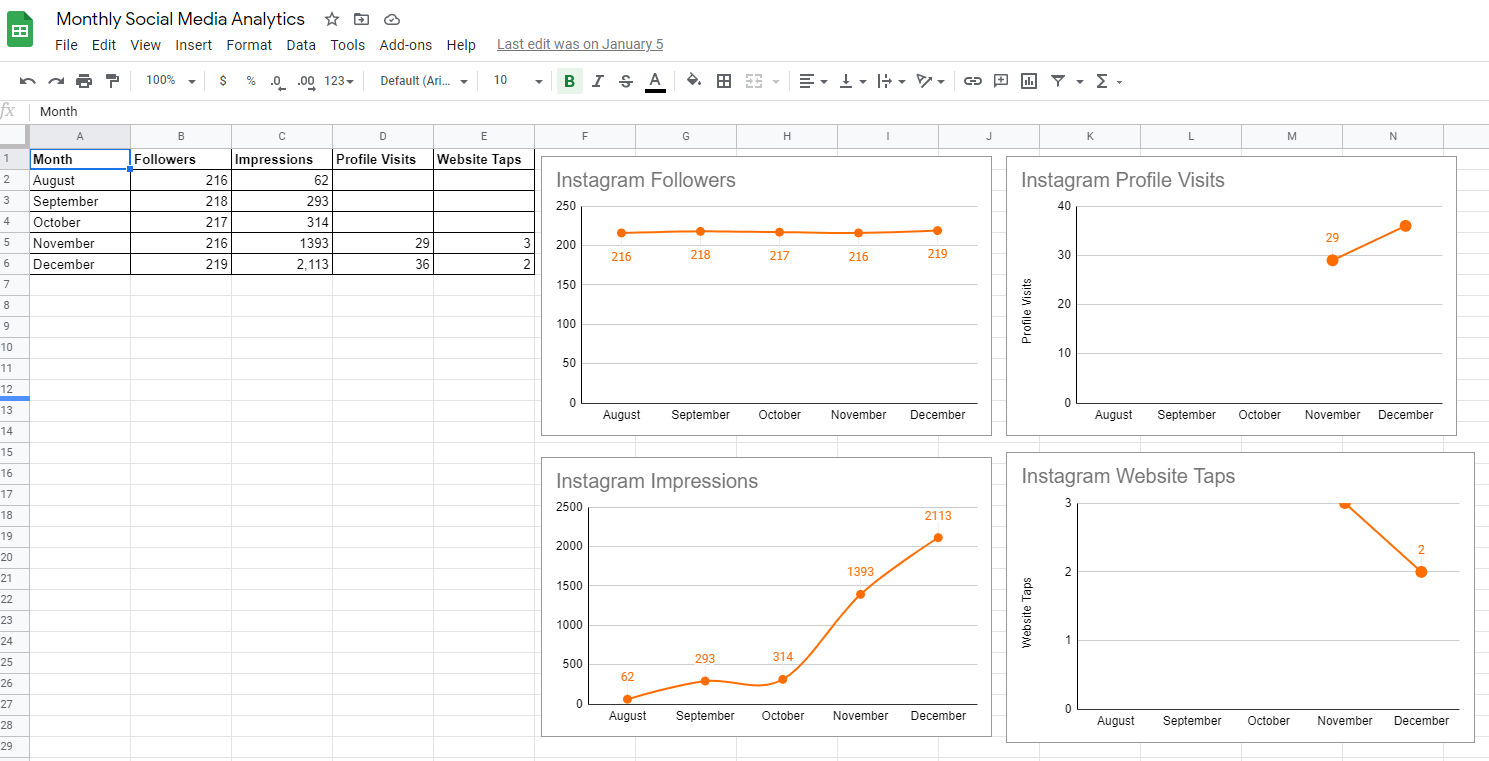
After creating the charts in Google Sheets, you can copy the chart and paste into a Google Document for easier data presentation. Since Sheets and Documents are both in the G Suite, this keeps the data linked between the two documents. So once you have these both set up, simply add the data to the table in Google Sheets, then open your Google Document and hit the “Update” button on each graph and it will automatically update with the new data you just added to the table.
TRENDING TOWARD GOALS
Each type of social media metric is a piece of the puzzle when understanding your overall performance. It’s easy (and exciting) to track increases in followers, but the amount of people seeing your posts (impressions and reach) are equally as important, even if they are harder to understand. And tracking these metrics over time will help you see trends in audience engagement, content and timing to help you achieve your social media goals.